


Streak Camera : Error corrections
Streak camera sensitivity along the time axis
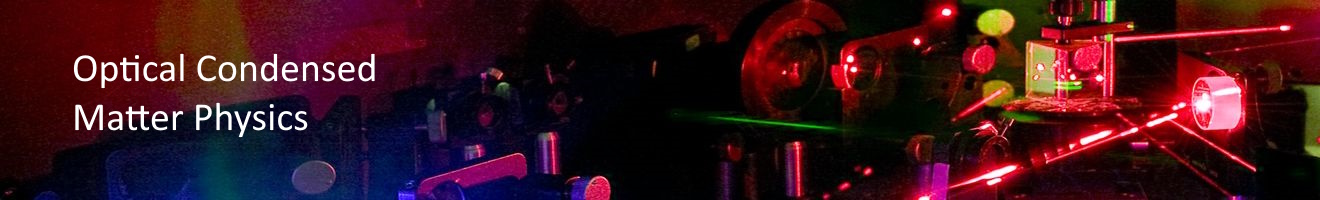
The streak camera was used to measure cw (continuous)light, in this case a white LED.
Since this light has no time dependence, it should have the same height, at all timevalues.
The following data was measured with Synchroscan timebase 4 (30000×56 ms exposures, monochromater slit 10 micron, streak camera slit 20 micron).
[ file: : D:\Lab documentation\5117.-109 Streak camera\Anomaly correction measurements\2016-02-25 LED TB1-4\timebase4.txt.
Download raw data: led_tb1-4.zip ]
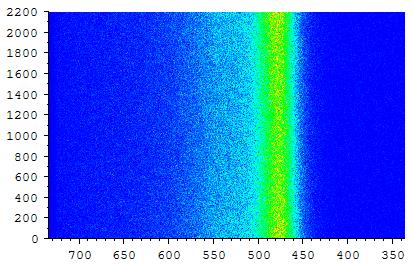
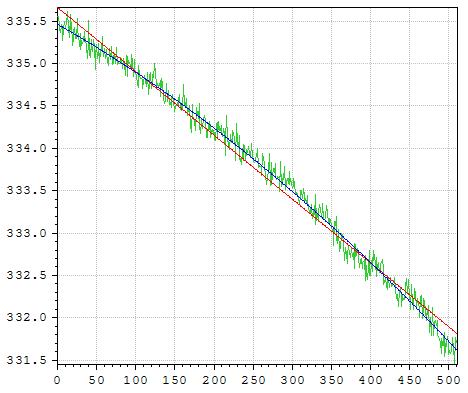
If this data is integrated over all frequencies (x-axis), is normalized so the center has height 1, and is displayed as a function of time (red, in ps):
[ file: D:\Lab documentation\5117.-109 Streak camera\Anomaly correction measurements\2016-02-25 LED TB1-4\Analysis\timebase4 fit.txt ]
It is not a straight line, as it should be, but somewhat quadratic. The blue line is a 2nd degree polynomial fit. A 4th degree is even slightly better.
Possibly, the time sweep is not linear : maybe it is slower at the beginning and the end, and would then accumulate more photons.
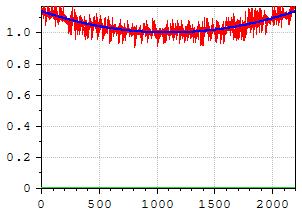
To test this, a series of exposures was made with the light of the Mira, going through 2 (roughly) 50% reflecting, parallel mirrors, separated by 22.2 (+/- 0.1) mm. This produces a pulse, followed by a second pulse (about 5 times smaller), delayed by 148 ps (and even an entire weaker and weaker pulse train). By using different delay settings of the streak camera, this pulse pair was measured at 9 different positions on the time axis. At each position, the pulses where fitted, and the time delay between the 2 was determined. If the time-axis of the streak camera is non-linear, these time-delays should appear different at different position on the time axis.
[file: D:\Lab documentation\5117.-109 Streak camera\Anomaly correction measurements\2016-03-07 Linearity Timebase 4\Analysis\DeltaT vs T.txt]
The y-values are the time difference between the 2 pulses. The x-values are the center-time of the 2 pulses. There is some difference between the delay of the time pulses. But it looks like this non-linearity is not enough to explain the quadratic behavior.
It is unknown what the reason is. It looks like the ‘sensitivity’ of the streak camera is time dependent, although this does not make much sense.
But, as a first order approximation, one could simply divide the streak camera data by the quadratic blue line (see MatrixCalc, tab ‘Streak’,’ Correct Z along time’ );
In the following graph, the ‘sensitivity’ deviation is show for all 4 synchroscan timebases. (1: yellow, 2:green, 3:blue, 4:red) (using a 2nd degree polynomial fit)
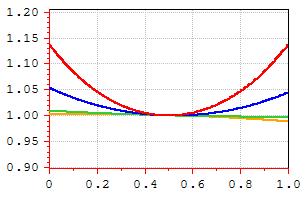
[file: D:\Lab documentation\5117.-109 Streak camera\Anomaly correction measurements\2016-02-25 LED TB1-4\Analysis\timebase1-4.txt]
To compare them, the time-axis (x-axis) is normalized to 1. Basically, only timebase 3 and 4 deviate significantly.
In the following graph, the ‘sensitivity’ deviation is show for 4 single sweep timebases. (5ns : red, 10 ns : green, 20 ns : blue, 50 ns : orange) (using a 2nd degree polynomial fit)
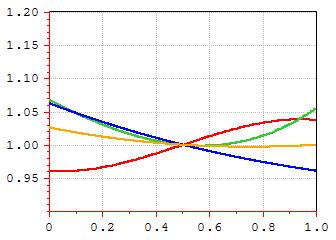
[file: D:\Lab documentation\5117.-109 Streak camera\Anomaly correction measurements\2016-03-01 LED SingleSweep\Analysis\SingleSweep 5-50ns sensitivities compared.txt]
The error in the green and blue curve is estimated to be 10%; So if needed, a better measurement has to be done.
Streak camera image tilt/shift
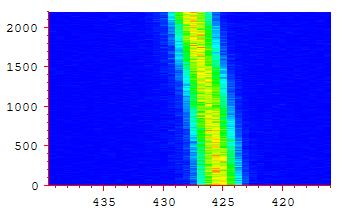
Using Synchroscan timebase 4, also the calibration lamp was used as a CW light source (2nd image is the line at 425 nm)
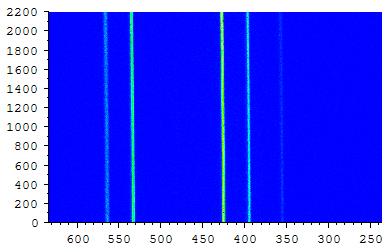
[ file: D:\Lab documentation\5117.-109 Streak camera\Anomaly correction measurements\2016-02-24 Calibration lamp TB4\3.img ]
The lines seem to be sligthtly tilted or shifted. One explanation might be that the CCD camera to record the image is slightly rotated. The positions of the maximum of the line at 425 nm were determined as a function of time :
[ file: D:\Lab documentation\5117.-109 Streak camera\Anomaly correction measurements\2016-02-24 Calibration lamp TB4\Analysis\Positions img3 425 nm as pixelnrs .txt ]
The x-axis is now the array-element number along the time axis. The y-axis is the array-element number along the frequency axis.
The green line is the position of the maxima. . It is not a flat line, as it should be.
The red line is a fit with a 1st degree polynomial, the blue line a 2nd degree polynomial.
The fact that a 2nd degree polynomial fits clearly better, seems to rule out the explanation that the CCD camera is simply rotated.
But, as a first order approximation (using the 1st degree polynomial), one could assume the image IS rotated, and then correct it, by rotating the image by -0.432 degree CCW from the x-axis (see MatrixCalc, tab ‘Streak’, ‘Rotate (deg)’).
2. Using the same method to fit the LED data of SynchroScan Timebase 1-4 with 2 gaussians yields :
| Time base | Angle |
| 1 | -0.433 |
| 2 | -0.411 |
| 3 | -0.409 |
| 4 | -0.416 |
(average angle = -0.417)
NB: for all 4 datas : a 2nd degree polynomial fits better !
Using the same method to fit the LED data of SingleSweep 5-50nswith 2 gaussians yields :
| Time base | Angle |
| 5 ns | -0.428 |
| 10 ns | -0.585 |
| 20 ns | -0.464 |
| 50 ns | -0.473 |
| 50 ns B | -0.418 |
| 50 ns C | -0.397 |
NB: for all datas : a 2nd degree polynomial fits better !
It might be that it’s not the CCD camera which is slightly rotated, but e.g. the sweep electrodes are slightly non-uniform, so the electrons are not swept perfectly vertical (in time), but slightly deviated.
Streak Camera : Triggering
The photodiode
A little bit of the light of the Mira, is reflected with a transparent pellicle to the C1808-03 photodiode. [ a spare pellicle is in the cupboard. Thorlabs BP108].
It look like the pellicle works as an interference filter, so the reflection is lower at certain wavelengths.
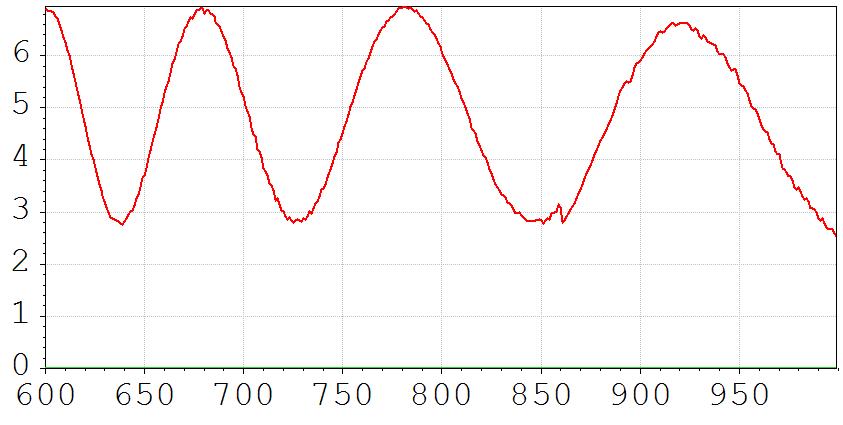
Here is a graph of the percentage reflection (P-polarization. The laser is horizontally polarized) :
The green light at the side of the streak camera indicates if it gets triggered. If it is not on (and the mira is modelocked), open the variable OD-filter, or put the HP amplifier to 40 dB.
If there is too much trigger signal, it is also not good.
According to manual : “Instruction manual for universal streak camera C5680” , near end :
Light on photodiode : 500 micro-W = 5 mW @ 800 nm : output level : 1.5 V p-p in 50 Ohm
Single sweep
The Single sweep unit uses the trigger signal of the photodiode, but also a signal of the pulse picker. In the C4792-01 menu, the Trig.Mode should be set to Dump Mode !! Otherwise the green trigger light on the side of the streak camera just blinks once a second.
Display on scope
If the signal of the photodiode should be placed on the oscilloscope, then before disconnecting the coax from the photodiode, first the bias power should be turned off.
Streak Camera : Entrance slit
The 0 position of the micrometer is exact. 'Just' closed, is exact at 0.
The first 1 mm of the micrometer is very 'fine' 1-5 mm is 'course'.
This also is shown by the horizontal lines on the fixed part of the micrometer.
The lines for the first mm are spaced further apart then the lines 1-5 mm.
Focus mode : 0-5 mm
Streak mode : 5-30 micron (according to manual) (Ben : 20 micron)
Streak mode, faint light : 30-100 micron (acording to manual)
The slider above the slit-micrometer should be no larger the the width of the photocathode (according manual).
If there are any vertical stripes on the spectrum, it is possible that there is a dust particle on the slit : Instead of going from 0→ 20 micrometer, open it much more, and then go back to 20 micrometer.
Red UNCAL light
NB : in focus mode the uncal light is always on !!
This error light can go on when using the synchroscan unit. The timebase runs sychronously with the 79 MHz (?) of the Mira laser, using a phase locked loop. If the frequency differs to much, the “SWR” Standing Wave Ratio (reflection/absorbtion) becomes to high, the time base stops and the red UNCAL light goes on.
The frequency can be adjusted with a little screw on the synchroscan unit, on the front, left, between the cooling ribs. It's difficult to adjust, maybe a plastic screwdriver is needed. Use it, to make the SWR as low as possible.
Best, first try it with timebase 2, and then switch to timebase 1.
If the synchroscan unit becomes warmer (mostly timebase 1), the SWR rises again.
Working stable with timebase 1, requires it to warm up for 1 hour : do not put it in 'Focus' mode, but keep it on 'Operate'.
Obviously, the trigger signal should be large enough (green led on the side should be on).
Streak Camera : General measurement overview
Switch on
- lasers
- computer
- Switch all streak camera electronics on. HP amplifier should normally be on 20 dB, but sometimes possibly on 40 dB.
If laser is mode-locked and the Streak camera gets triggered, the little light at the side is green.
Trigger photodiode optimization ?
- before unplugging, switch of bias.
Single sweep unit : with pulse picker (2 MHz ?). Longest decays.
Synchro sweep unit : at 76 MHz. Only for very fast decays.
Synchro : fastest timebase (1) warms the streak camera, so it needs quite some time to stabilize, for stable time base !!
Synchro scan timebase 1 : Do alignment (lateral movement, first lens) not in focus mode, since this will cool down the streak camera.
[ Keeping the streak camera all the time in Operate mode is fine. It will keep warm ]
In range 1, the meter on the streak camera (indicating the reflected power) should be as low as possible. Use the pot-meter on the front to tune the impedance.
Top box is for Synchro, Bottom for Single. All delays can be computer controlled.
Shutter before streak camera (red arrow)
- Left : closed, top 0 position, to the right : open.
- Max open at right 90 degrees.
- NB: vertical stripes in spectrum are caused by dust particles.
- Best practice to remove dust particles on slit : open 180 degrees, then back to wanted position.
Align general optics
- Close slit of Mira until laser is just visible. Beam is weakened.
Hollow fiber
- Most of the time the light directly from the Mira is used (fast decays). If needed the light behind the pulse picker can be used (slow decays).
- Best pump wavelength : 820 nm. 4.6 watt is enough.
- Align: use 35 mW (max 50 ?) until it works, then +/- 90 mW for better aligning.
[ it should work @ 50 mW, but maybe not yet @ 35 ]
- Max entry power : 1 W (?).
- Normal use e.g. 70 mW.
- Alignment : use IR-viewer to see the light passed (most of it is IR), which falls on piece of paper.
- Adjust mirror just before variable OD-filter for max throughput. The more white, the better. Very sensitive.
- Put interference filter after fiber (546 nm) & RG1 filter (absorbs IR).
90 mW in : 104 microW out (green)
74 mW in : 44 microW out (green)
[17 mW passes through the fiber (?) ]\ \
Synchroscan
- 165 ps
- 800 ps
- 1450 ps (delay ~ 8840 ps)
- 2200 ps (delay ~ 9600 ps)
going fro 4→1, above threshold drops
Software
HPD-TA 32 program [NB : This is for the old program ]
- On start, select IC-PCI+AM-DIG & C4742-95 at 1
- Config : c:\program files\HPDTA32\digital.cnf
- F8 is panic button : all shutters close etc.
Time range : 1 = fastest, 4 = slowest.
Focus : no time-spread. so all light falls on center of mct. Potentially dangerous !! If focus-mode, a little red light shows on side of streak-camera.
Focus-time-over : 5 minutes. Focus auto shuts off after 5 minutes.
The shutter of the streak camera is behind the entrance slit.
MCP gain : 0-63. Start with 10-20. For Single Photon counting : use 63.
Normal delay time : 9060 ps. Enter box, use up/down arrow to change (moves life image up/down).
Show signal Press “Acquisition”, Live, Live.
“Use auto streak shutter & MCP gain ?” : No. (yes uses previous settings & opens shutter).
ROI: select calibrate.
Button bar at the right, select
- Show or hide the quick profile
- Show or hide the ROI I/F window
- Select a rectangular ROI
ROI window : select calibrated
Menu analysis : select Profile
Menu
- Setup, scaling
- Set spec calibration
- set grating 40
- Pixel location +- …
- Assign scaling
- System scaling setup :
- [x] Assign scaling tho image
- ROI GetH
Photon counting
- First : Setup : determines threshold [ ~ 80 = threshold]
LUT : left 30, right 60-70
Chromex monochromator
Most used grating : 40.7 micrometer.
Calibrate always when switched on again.
Calibration lamp before monochromator (546.08 nm peak ).
Life acquisition mode, slit monochromator: 10 micron, MCP gain 10, slowly open shutter.
Resolution monochromator is 0.7 nm.
Adjust calibration: ???
example
pixel wavelength [nm]
868 539.6
875 543
878 546
(so about 0.7 nm / pixel)
Best camera slit value (the one with the red arrow) : 20 micron (see top).
Less: light loss, More: more signal but time resolution loss.
Alignment after fiber:
Insert 1 mm cuvette with Rhodamine 6G or so.
Optimize the 2 microscope lenses by: ???
Final measurement : Photon counting.
Select a small area which is most crowded. …max 5% or so. Means 5% of the pixels contains a photon.
Exposure not smaller then 56 ms. Otherwise to much loss for read out
Threshold: make image with 1000 exposures. run Setup. threshold around 80 is fine.
Exposures e.g. 10000 = 30 minutes
LUT
- Don’t forget to push the ‘*’ on LUT for auto set. Auto goes minimal to 16, but can go to 4 with arrows.
Change sample
- Only adjust lateral translation of the lens closest to the sample.
- Clean cuvettes on the outside
Cut-off filter before monochromator
OG 570
Synchroscan
Little meter shows the amount of bounced signal due to impedance mismatch. This can cause the streakcamera to stop. Minimize : there is a little hole to the left of the front, which gives access to a variable capacitor.
One of the gratings inside the monochromator (300, or maybe 100 lines/mm) is replaced by a 2400 lines/mm !!!
The lens system between the monochromator and the streak camera is made of quartz. For different wavelength it might be necessary the change the focus of this system a bit (big ribbeled ring), since it is not completely achromatic. And if focus is not good, so is the time resolution. There is also a lense between the streak-camera and the ccd-camera : loosen the screw, and turn the ring between the streak and ccd camera, for best focusing.
Switching of Synchroscan to SingleSweep unit
- Remove trigger cable from unit & remove smc plug.
- Remove Synchroscan unit : push buttons and rotate backwards. The rotation pushes the unit out. Be carefull to to move the streakcamera itself. Maybe do 1 button at a time.
- Enter SingleSweep unit : in principle the unit will be pulled in by rotating the knobs. A little pushing might help. Be carefulll not to move the streak camera. Be carefull not to damage the pins of the connectors. Check afterwards if the unit is really pushed in.
- Output of HP amplifier to input C4792 (single scan delay box).
- C4792 StreakOut output to SingleSweep unit.
- If the laser is modelocked, both the ModeLock Clock and the External Trig on the C4792 unit are green. (1 is the modelocked frequency, 1 is the signal from the pulse picker).
- In HPDTA program : start, Profile, Load profile : “c:\programdata\Hamamatsu\HPDTA\SingleSweep.hwp”
- In C4792-01 menu : Trig.mode → Dump Mode !!
- Dly1 dumpmode : coarse delay (in ps). Holding shift (?) while arrow up goes faster
Dly1 dumpmode : fine delay (ps) : delay is also shown on C4792 box
Options, Devices, Delay generator : here you can choose which settings are saved to disk on leaving the program
SingleScan unit
TimeBase -- Delay
100 ns - -300 ns (?)
50 ns -- 390 ns
20 ns -- 460 ns
5 ns -- 500 ns
The delay also depends on the height of the laser beam above the transduces of the pulse picker.
Playing with the delay, you can see 2 time traces. One for the forwards sweep and one for the backwards sweep. Use the one where the increasing time goes from top to bottom.
OG570 / OG590
OG570 transmits a little bit of the green light produced by the fiber. Use this to align the signal, if no fluorescence can be found.
Triggering
The fastest synchro-timebase is the most sensitive for the trigger signal.
If the red “uncal”-led (close to the impedance mismatch meter) glows, there might not be enough light falling on the trigger photodiode.
According to the manual : increase the amount of light, so the triggering happens earlier. If it starts triggering later again, it’s just to much light. Put it at the earliest triggering moment.
Purging & cooling of Mira
From the manual :
Cooling water :
- max temperature : 15 C
- min flow rate : 0.3 liter / minute
- pressure : 2 bar
purging with dry N2 :
- Initial purge : 10 CFH
- Later purge : 2 CFH
Purging is especially recommended for operation above 870 nm.
Strong water absorption : between 920 and 970 (high velocity purge needed for several hours to get below 5%).
Other water absorption's : around 761 +/- 5 nm and 820 +/- 5 nm.
Take a look at the aborption spectrum of water in the atmosphere.
From this absorption spectrum, it follows that above 890 nm, the water absorption begins !!