


Mirrors, wavelength and more
There are (at least) 2 types of spectroscopy mirrors :
- dielectric mirrors
- metal coated mirrors
Thorlabs :
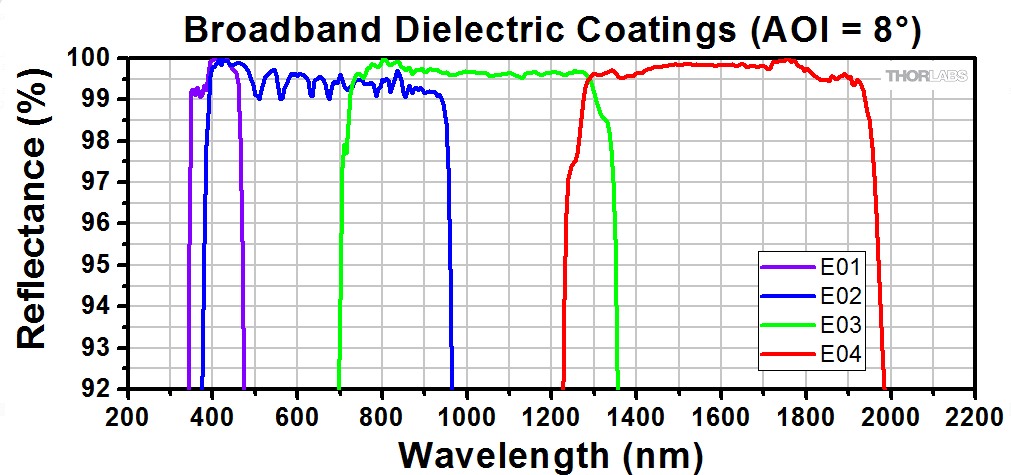
The coating of dielectric mirrors consists of multiple layers of material with different indices of difraction. These layers produce a destructive interference in the forward direction, and hence a constructive interference in the backwards direction : they function as a mirror. It is the same principle as the anti-reflection coating on sun glasses.
The advantage of dielectric mirrors is : high reflection, high damage threshold, more 'scratch' resistant
Disadvantage : reflection is angle dependend, not so broadband as metal coated mirrors, expensive. Not to be used for fs (or ps?) pulses.
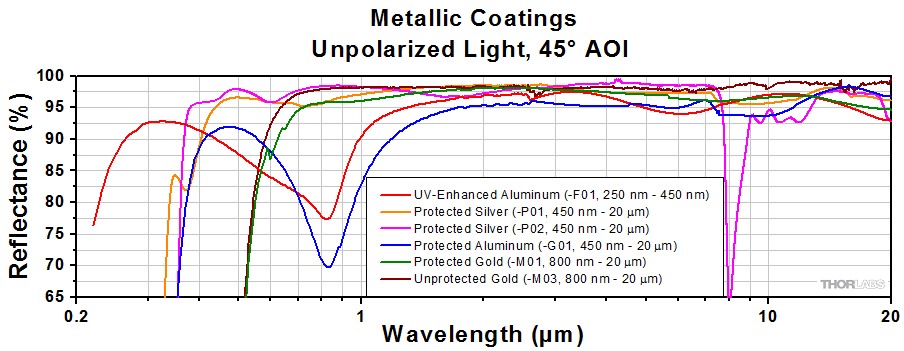
The coating of metal coated mirrors conststs of a thin layer of metal, with optionally a protected layer on top of that.
The layer can be alluminium, silver or gold. Below 400 nm, use alluminium, otherwise silver. Perhaps for the infrared gold might be better.
The unprotected mirrors reflect usually a little better, but are (much) more prone to scratching. Most mirrors are protected.
The advantage of metal coated mirrors is : cheaper then dielectric, more broadband then dielectric. Reflection is only slightly angle dependend. Usable for fs pulses.
Disadvantage : lower reflection then dielectric, lower damage threshold.
The workhorse for our group is : silver protected mirrors -P01.
Use aluminum mirrors for below 400 nm or so (see graph).
Thorlabs price for 1" round mirror
Dielectric E02 : 82 euro
Silver -P01 : 57 euro
Newport
BD1 : Broadband dielectric 1 : VIS 488-694 nm ( 75 euro, cheapest. Depends on substrate)
BD2 : Broadband dielectric 2 : NIR 700-950 nm
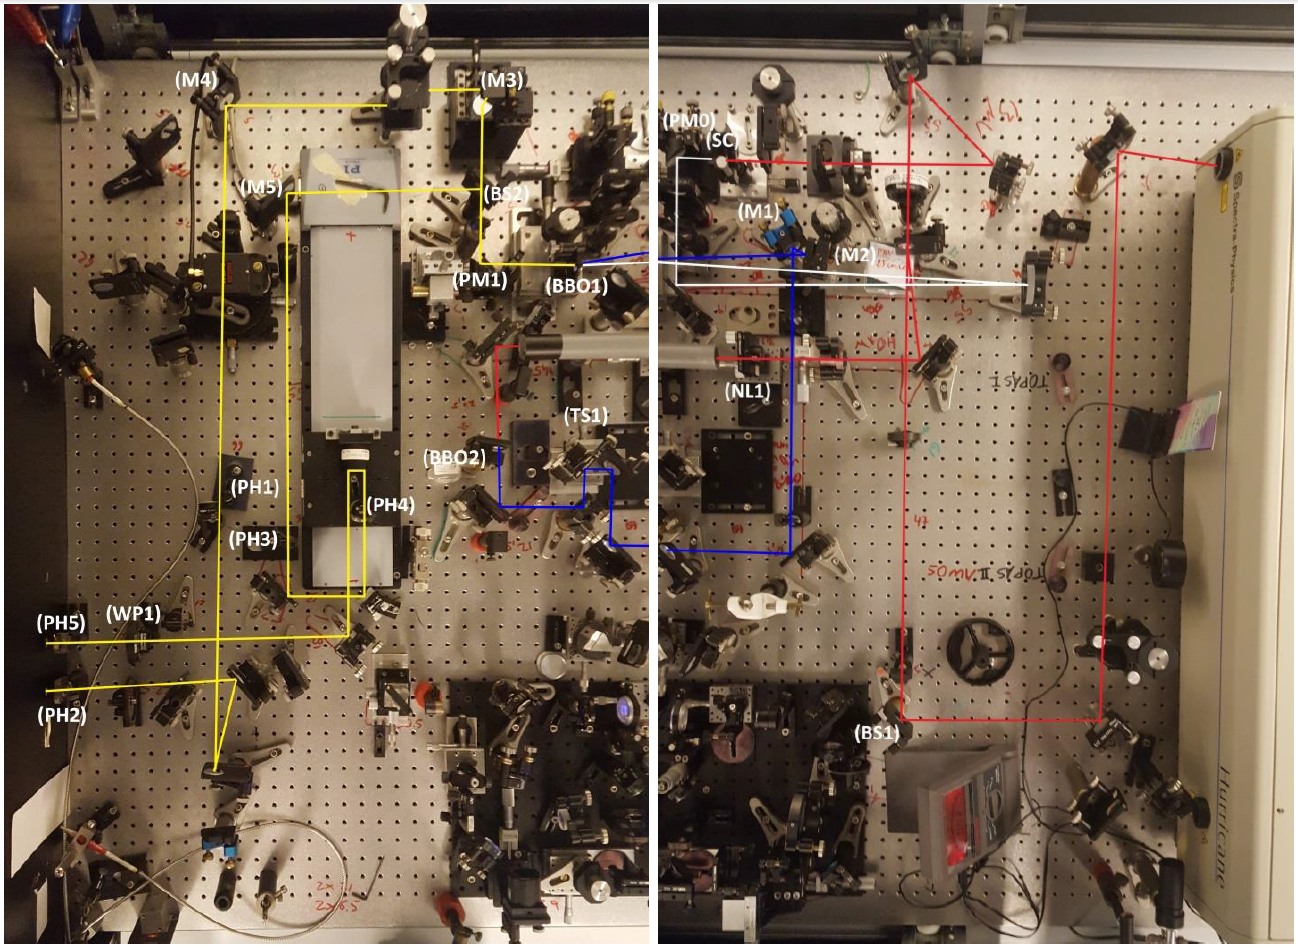
2D-setup manual
by : Jan Hidding (june 2018)
original file in pdf format
Turn on system
- Interlock on
- Turn on laptop hurricane (com port: 2)
- Turn on SDG-II (backside)
- Turn on oscilloscope
- Big chiller
- Amplifier (knob then key)
- Fan (under table)
- Dazzler (backside)
- Laptop dazzler
- Power supply for diodes
- Lockins
- Turn on PC
- Spectra-Physics box: Wait until “TEMP” stops blinking. Then Laser on/off (keep pressed until laser starts)
- Laptop hurricane: ON/OFF (keep pressed for few seconds, wait for laser to warm up)
- Laptop hurricane: Shutter (keep pressed until red box lights up)
- After warming up is complete: ON/OFF (keep pressed until “Emission”)
- Wait for power to ramp up (“pulsing” indicator should go on)
- Reset on SDG-II
- Wait for hour to let laser warm up
Align everything to increase output power and get peak position of spectrum at 590 nm (16950 cm-1)
- Use beam splitter BS1 to align beam in to NOPA. Look at spectrum from OCEAN to see if signal is increasing in power
- To improve temporal overlap of blue and white light in BBO crystal, change translation stage TS1. SENSITIVE! Translation stage can be used to get peak position at 590/595 nm
- Improve spatial overlap of the two beams by changing the direction of blue light with M2 or M3
- Align white light ONLY slightly with PM0 into BBO crystal
- If profile of white light is off (spatially chirped), change the knobs of the sapphire crystal (SC) to improve the white light beam profile
- Changing upper knob of BBO crystal (creating broad spectrum) may also improve signal
- Changing 2nd harmonic creating BBO crystal (BBO2) may also improve signal slightly
- Power can be increase with focus of negative lens (NL1) in the telescope configuration. This will deteriorate beam profile (good profile is more important than higher power)
- If beam profile is off, try changing sapphire crystal slightly to get a round homogenous spot
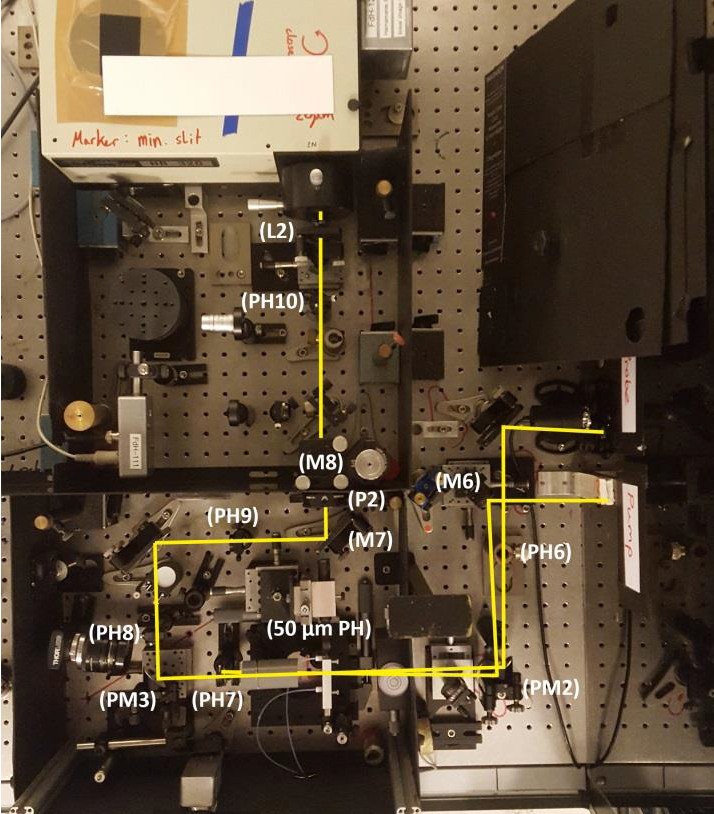
Align probe and pump through pinholes and into spectrometer
- If everything is aligned, one should be able to align probe and pump through pinholes PH2 and PH5 with the parabolic mirror PM1. If not, probe has priority
- Pump is aligned through PH1 & PH2 using M3 and M4 respectively
- Probe is aligned through PH3, PH4, PH5 & PH6 using BS2 and M5. Good alignment with PH4 is important as delay stage needs to be well aligned. Another removable pinhole PH6 should be used on the other side of the board to align probe in to spectrometer
Alignment after board into spectrometer
- To see spectrum on PC: “Extras” -> “Show continuous”
- Check whether probe goes through PH7/8/9/10 and in to spectrometer (without cuvette and pinhole intensity on PC should be around 0.3)
- When misaligned, slightly change PM2 to get in through PH7 and PH8 and PM3 to get it through PH9
- Use M7 and M8 to align through PH10 and increase signal strength. Also use these mirrors to remove any strange fringes in the spectrum
- Lastly change the lens L2 to increase signal
Align pump and probe through 50 μm pinhole
- Block pump beam and align 50 μm pinhole with probe beam (Therefore, only use the stages that translate the pinhole orthogonal to the beam. Do not change the focus position.)
- Block probe beam and align pump beam into pinhole using M6
- Make sure that PH7 is blocking pump and not probe pulse
- Install cuvette and align with pinhole. Use level to position cuvette horizontally
- Block pump and get back reflection of probe on to pump to get a small angle relative to probe
- Clear and measure baselines
- Dim lights and block probe and pump
- “Extra” -> ”Clear baselines”
- “Extra" -> ”Measure baselines” (10000 pulses)
Pump probe to determine time zero (t0) and check if everything is in order
- Set power pump & probe to 200nW (dim roomlight!, take pulse repetition rate into account to set the proper pulse energy, because ΔE=Pavg/f)
- 500Hz 100nW
- 1000Hz 200nW - Use dazzler to chop the pump pulse (fpump=500 Hz, fprobe=1000 Hz) by putting dazzler to A/B mode -> “Load”
- Check if polarization of probe and flow direction are correct
- PC: “Scan” “Select input” -> check:
“VisArray…1.ClockedInput1D_1” & “VisArray…1.ClockedPumpProbeInput1D_1” - Roughly determine t0 by scanning large range with large step size “Scan” -> "Scan"
- Scan motor: PIDelay_1
- Start position: -5000 fs
- End position: 5000 fso Delta position: 20 fs (better use 20 fs here. Otherwise your time zero is ±200fs) - Obtain t0 by fitting integrated signal with XYY
- Move stage to t0: “Motors” -> “Move motor(s)…” -> PIDelay_1=t0
- “Scan” -> “Multi-delta scan…”
- Scan Motor: PIDelay_1
- Delay#1 : 1, NrAverages: 10, Make bidirectional scan
- Start -1000 (delta 200), -200 (delta 20), 1000 (delta 100), 5000 (delta 200), End 30000
2D measurement
- Put Dazzler back to A mode and to “zero”
- Check power of pump and probe (to be sure)
- PC: 2DFT Dazzler -> Settings:
- Nr averages=250
- Max delay (fs)=300/400
- Delta delay=0.6
- Nr Phase states=2 : Multiplier phase 1=1, Multiplier phase 2=-1
- Save single scans: None
- Mark “Crop the X-axis to the spectrum” - To determine whether there is a lot of scattering from the pump, one can block the probe and run a short scan to see whether there is diagonal signal due to scattering:
- 2DFT -> Scan - For real measurement: 2DFT -> Dual loop scan -> Single loop:
- Start position: 0 fs
- End position: 1000 fs
- Delta: 100 fs
Microscope filters
Dichroic mirrors : 25x36x1 mm
Emission filter : 25 mm round with ring
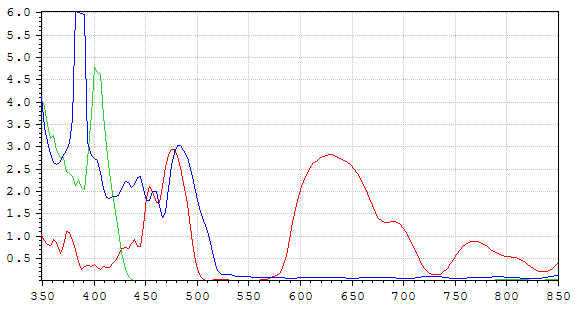
Currently installed :
[ Measured at ~45 degrees in absorbtion spectrometer. X-axis=wavelength, y-axis=absorbance. This should be similar to reflection ]
- [red curve] ?
- [green curve] used by Artur: Dichroic ?, emission : ET425LP
- [blue curve] dichroic probably T525lpxr, emission : HQ595/20M
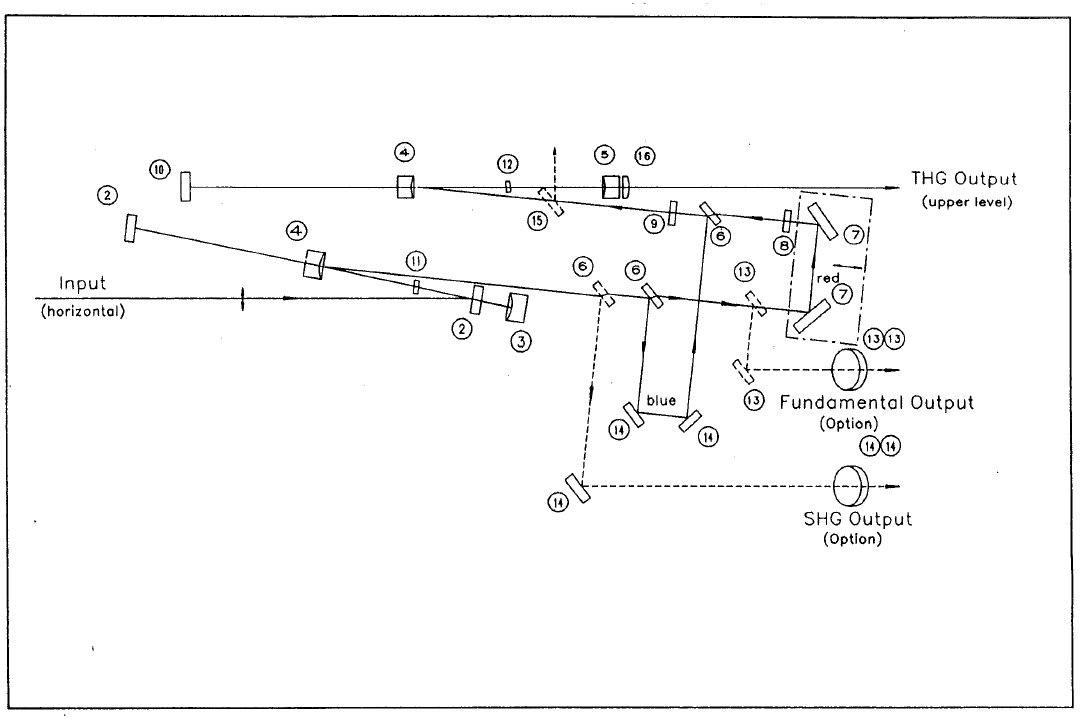
Frequency doubler / tripler
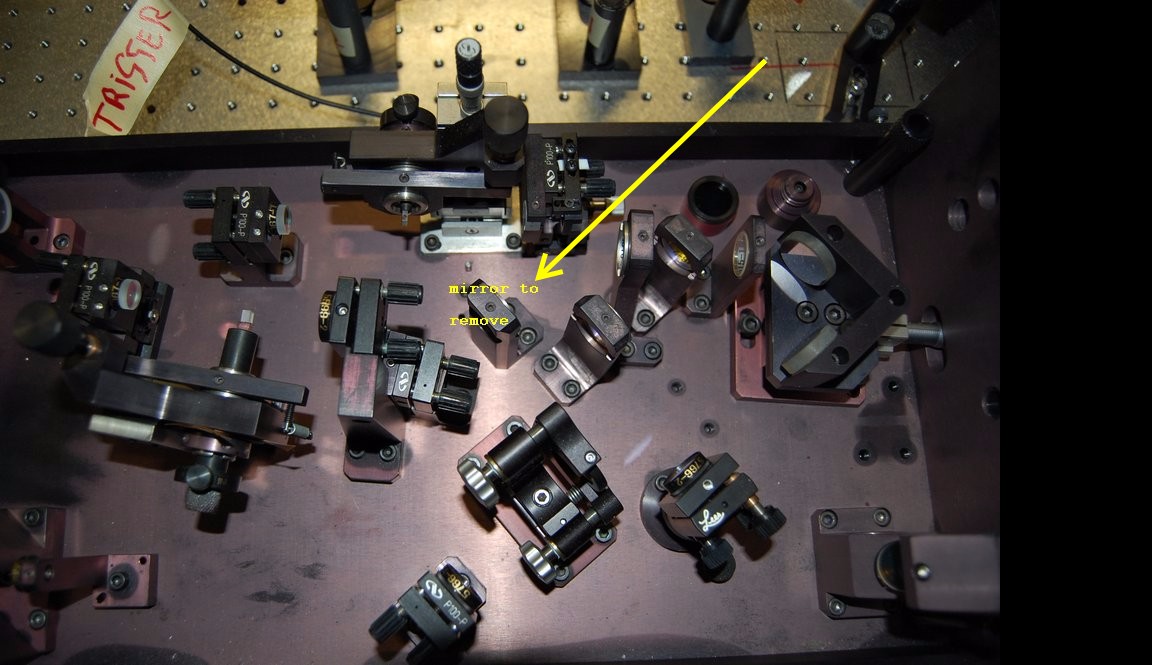
- Remove first dichroic beamsplitter for switching between doubling and tripling [left # 6, 2 screws]
- Red filter on output blocks fundamental (or doubled ?)
- Rotate axis of second crystal is test for really tripling the light
- Time overlap fundamental and doubled is very critical
- To focus the light in the second crystal, use the horizontal knob
- Overlap fundamental and 2 nd harmonic use second mirror 14
- Fundamental and doubled are co-linear
- To make better collinear : beamwalking of 2x mirror 14
- Top : tripled, bottom doubled.
- Instead of red filter, use UG11 with tape on the top hole, to block the doubled light
- SHG crystal is now 3 mm, instead of original 1.5 mm. Fast times are not very important.
Both doubler and tripler tuning knob : clockwise to higher wavelength.
2nd crystal (BBO) is now 2 mm.
Verdi : 4.5 W
810 nm → 405 nm, 2 MHz : 0.55 mW
Verdi : 5 W
885 nm → 295 nm, 2 MHz : 28 micro watt
13-7-2015
Verdi 5W, humidity : 33%
895 nm, monitor 129 (modelocked) : 26 microwatt doubled
907 nm, monitor 122 (modelocked) : 3.6 microwatt tripled
909 nm, monitor 118 (modelocked) : 2.6 microwatt tripled
911 nm, monitor 108 (modelocked) : 0.8 microwatt tripled
21-9-2015
Verdi 5W, humidity 34%, 911 nm, monitor 109 (modelocked) : 7 microwatt tripled.
Ben helped :
- FdH : also used the fine tuning of the Mira : this helped a bit.
- In pulse picker : adjusted height helped a bit.
- First #14 mirror tweaked = overlap Fund. & SHG : this helped.
- Better time overlap : it looked that the time overlap got stuck. Maybe the delay stage is dirty & stuck. Try push.
- Whilelooking at the THG power, change prism of mira a bit : this can make the pulse shorter.
10-11-2015
Verdi 5W, humidity 34%, 811 nm, monitor
Doubled output 0.36 mW (2MHz) Should be more ?
Bypass pulse picker
After the end mirror of the pulse picker, 2 spots can be seen : a bright spot, which is blocked, and a faint spot, which is transmitted. The faint spot are the pulse-picked pulses.
Insert an 3/32 allen key in the top screw of the endmirror, at 8 o'clock position. By turning it clockwise to the 4 hour position, both spots are moved upwards, and the unpicked pulse now falls on the mirror in the doubler (M2 right).
In order to be completely unblocked, the unperturbed beam fell a little higher on mirror M2 then the picked one.
Realignment doubler
Use M2 (right) and M2 (left) to steer the beam correctly in the crystal. NB : changing the pulse picker output angle, M2, M2 etc. etc has immediately effect on the needed angle of the crystal.
NB : while aligning, the Mira sometimes dropped out of mode-locking : maybe some light bounced back. A slightly different alignment of the 2 M2 mirrors seemed to help. It also helps to close the Mira slit a bit more, to make the mode-locking more stable.
Final alignment : use right M2 to put the beam at the correct height on the left M2 mirror. Align the left M2 mirror, so the doubled beam is at the correct height a few meters away from the doubler.
Only the 2 M2 mirrors are used!
The original heights are (for the pulse picked beam) :
M2 (right) : 7.8 cm (slightly below middle)
M2 (left) : 8.1 cm (slightly above middle)
M3 (before crystal) : at the lower part of the mirror
M6 (left) : blue light at 5.4 cm
Far field : blue light at 13.0 cm
The heights for bypassing the pulse picker are :
M2 (right) : 8.1 cm
M2 (left) : 7.8 cm
5-2-2016
800 nm, 4.5 W, 18.85 A, Baseplate 22.69 C, RH 25%, Monitor 142 (ML)
With pulse picker : 0.34 mW at 400 nm.
Bypassed pulse picker : 22 mW at 400 nm (= 64 x more, should have been 40 x !)
Pulse picker
The output of the pulse picker consists of 2 dots. The upper one is the picked pulse, the lower one is the 90 MHz train.
Normally, the picked pulse is transmitted into the frequency doubler, and the 76 MHz train is blocked inside the pulse picker. It is possible to adjust the height of the thing at the exit of the pulse picker which blocks the 76 MHz train.
To ‘pseudo’ bypass the pulse picker, adjust the vertical position of mirror 2 (the one after the light passed the crystal ), so the 76 MHz beam moves up (over the blocker) and enters the frequency doubler. The pulse picker can be switched off completely somewhere at the back of the control box
- Optimize with power meter on the double or so result
- height of the beam through crystal : the lower and closer to the transducer the more efficient pulse picking. Too low, the beam gets clipped. Use an IR viewer to watch the area just before the crystal.
NB : changing the height of the crystal also changes the timing : it takes longer before the acoustic wave hits the laser beam
- Timing on the control box : coarse : don’t use, fine : use.
- Power to the transducer.
- Side knob : height of the crystal. You see if you move it on, it will go through several maxima. The best one should be the lowest (in position), without clipping. This height knob is an alternative to the timing on the controller.
- 2 top knobs : angle of crystal : both are needed !!
- Other side knob : focus (not so important).
- Pulse picker bragg angle is wavelength dependend !
Cleaning of the crystal
Very carefully. Use methanol (never acetone, dissolves the glue).
Use just a lens paper with a drop of methanol. Don’t use hemostat.
Opening the pulse picker
Push the little buttons at the sides inwards (have little levers on the inside), but make sure not to push the side plates themselves inwards.
Pulse picking frequency
Works with a divider on the control box. Max frequency is 2 MHz.
So divider on 20 → 1.9 MHz.
Menu alignment
Pulse picker runs in auto-run mode : easier for aligning
Numbers on display
1 65 106
100 80
20
[don't know if originally the 1 was really 1]
Verdi 5W @812 nm : Mira about 450 mW output. Measured with power meter and attenuator.
Pulse picker output about 7 mW. Efficiency = 60%. (According to Maxim, should be 90 %)