Pulse picker
The output of the pulse picker consists of 2 dots. The upper one is the picked pulse, the lower one is the 90 MHz train.
Normally, the picked pulse is transmitted into the frequency doubler, and the 76 MHz train is blocked inside the pulse picker. It is possible to adjust the height of the thing at the exit of the pulse picker which blocks the 76 MHz train.
To ‘pseudo’ bypass the pulse picker, adjust the vertical position of mirror 2 (the one after the light passed the crystal ), so the 76 MHz beam moves up (over the blocker) and enters the frequency doubler. The pulse picker can be switched off completely somewhere at the back of the control box
- Optimize with power meter on the double or so result
- height of the beam through crystal : the lower and closer to the transducer the more efficient pulse picking. Too low, the beam gets clipped. Use an IR viewer to watch the area just before the crystal.
NB : changing the height of the crystal also changes the timing : it takes longer before the acoustic wave hits the laser beam
- Timing on the control box : coarse : don’t use, fine : use.
- Power to the transducer.
- Side knob : height of the crystal. You see if you move it on, it will go through several maxima. The best one should be the lowest (in position), without clipping. This height knob is an alternative to the timing on the controller.
- 2 top knobs : angle of crystal : both are needed !!
- Other side knob : focus (not so important).
- Pulse picker bragg angle is wavelength dependend !
Cleaning of the crystal
Very carefully. Use methanol (never acetone, dissolves the glue).
Use just a lens paper with a drop of methanol. Don’t use hemostat.
Opening the pulse picker
Push the little buttons at the sides inwards (have little levers on the inside), but make sure not to push the side plates themselves inwards.
Pulse picking frequency
Works with a divider on the control box. Max frequency is 2 MHz.
So divider on 20 → 1.9 MHz.
Menu alignment
Pulse picker runs in auto-run mode : easier for aligning
Numbers on display
1 65 106
100 80
20
[don't know if originally the 1 was really 1]
Verdi 5W @812 nm : Mira about 450 mW output. Measured with power meter and attenuator.
Pulse picker output about 7 mW. Efficiency = 60%. (According to Maxim, should be 90 %)
Streak Camera : Error corrections
Streak camera sensitivity along the time axis
The streak camera was used to measure cw (continuous)light, in this case a white LED.
Since this light has no time dependence, it should have the same height, at all timevalues.
The following data was measured with Synchroscan timebase 4 (30000×56 ms exposures, monochromater slit 10 micron, streak camera slit 20 micron).
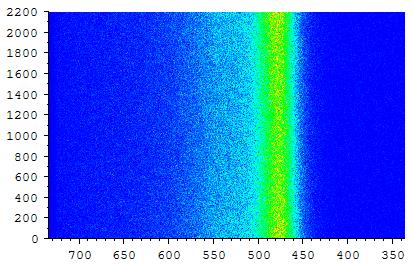
[ file: : D:\Lab documentation\5117.-109 Streak camera\Anomaly correction measurements\2016-02-25 LED TB1-4\timebase4.txt.
Download raw data: led_tb1-4.zip ]
If this data is integrated over all frequencies (x-axis), is normalized so the center has height 1, and is displayed as a function of time (red, in ps):
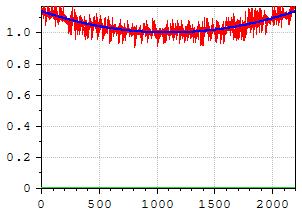
[ file: D:\Lab documentation\5117.-109 Streak camera\Anomaly correction measurements\2016-02-25 LED TB1-4\Analysis\timebase4 fit.txt ]
It is not a straight line, as it should be, but somewhat quadratic. The blue line is a 2nd degree polynomial fit. A 4th degree is even slightly better.
Possibly, the time sweep is not linear : maybe it is slower at the beginning and the end, and would then accumulate more photons.
To test this, a series of exposures was made with the light of the Mira, going through 2 (roughly) 50% reflecting, parallel mirrors, separated by 22.2 (+/- 0.1) mm. This produces a pulse, followed by a second pulse (about 5 times smaller), delayed by 148 ps (and even an entire weaker and weaker pulse train). By using different delay settings of the streak camera, this pulse pair was measured at 9 different positions on the time axis. At each position, the pulses where fitted, and the time delay between the 2 was determined. If the time-axis of the streak camera is non-linear, these time-delays should appear different at different position on the time axis.
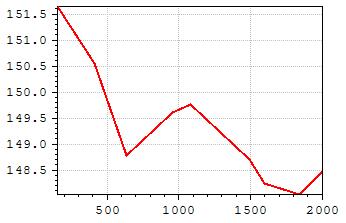
[file: D:\Lab documentation\5117.-109 Streak camera\Anomaly correction measurements\2016-03-07 Linearity Timebase 4\Analysis\DeltaT vs T.txt]
The y-values are the time difference between the 2 pulses. The x-values are the center-time of the 2 pulses. There is some difference between the delay of the time pulses. But it looks like this non-linearity is not enough to explain the quadratic behavior.
It is unknown what the reason is. It looks like the ‘sensitivity’ of the streak camera is time dependent, although this does not make much sense.
But, as a first order approximation, one could simply divide the streak camera data by the quadratic blue line (see MatrixCalc, tab ‘Streak’,’ Correct Z along time’ );
In the following graph, the ‘sensitivity’ deviation is show for all 4 synchroscan timebases. (1: yellow, 2:green, 3:blue, 4:red) (using a 2nd degree polynomial fit)
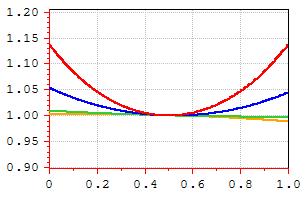
[file: D:\Lab documentation\5117.-109 Streak camera\Anomaly correction measurements\2016-02-25 LED TB1-4\Analysis\timebase1-4.txt]
To compare them, the time-axis (x-axis) is normalized to 1. Basically, only timebase 3 and 4 deviate significantly.
In the following graph, the ‘sensitivity’ deviation is show for 4 single sweep timebases. (5ns : red, 10 ns : green, 20 ns : blue, 50 ns : orange) (using a 2nd degree polynomial fit)
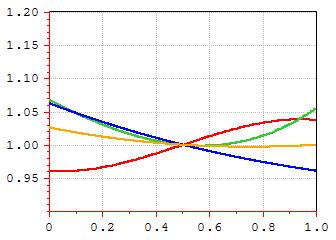
[file: D:\Lab documentation\5117.-109 Streak camera\Anomaly correction measurements\2016-03-01 LED SingleSweep\Analysis\SingleSweep 5-50ns sensitivities compared.txt]
The error in the green and blue curve is estimated to be 10%; So if needed, a better measurement has to be done.
Streak camera image tilt/shift
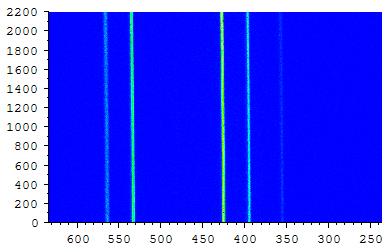
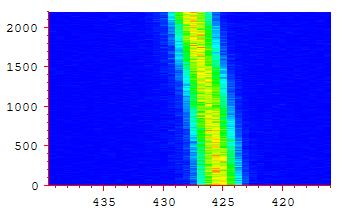
Using Synchroscan timebase 4, also the calibration lamp was used as a CW light source (2nd image is the line at 425 nm)
[ file: D:\Lab documentation\5117.-109 Streak camera\Anomaly correction measurements\2016-02-24 Calibration lamp TB4\3.img ]
The lines seem to be sligthtly tilted or shifted. One explanation might be that the CCD camera to record the image is slightly rotated. The positions of the maximum of the line at 425 nm were determined as a function of time :
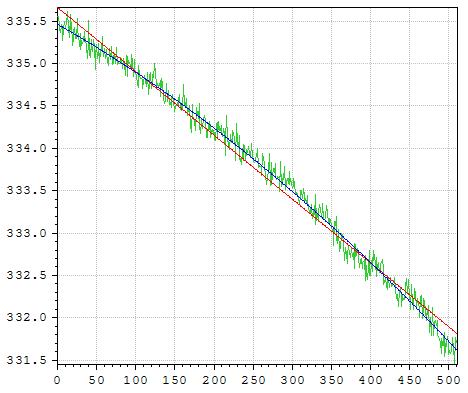
[ file: D:\Lab documentation\5117.-109 Streak camera\Anomaly correction measurements\2016-02-24 Calibration lamp TB4\Analysis\Positions img3 425 nm as pixelnrs .txt ]
The x-axis is now the array-element number along the time axis. The y-axis is the array-element number along the frequency axis.
The green line is the position of the maxima. . It is not a flat line, as it should be.
The red line is a fit with a 1st degree polynomial, the blue line a 2nd degree polynomial.
The fact that a 2nd degree polynomial fits clearly better, seems to rule out the explanation that the CCD camera is simply rotated.
But, as a first order approximation (using the 1st degree polynomial), one could assume the image IS rotated, and then correct it, by rotating the image by -0.432 degree CCW from the x-axis (see MatrixCalc, tab ‘Streak’, ‘Rotate (deg)’).
2. Using the same method to fit the LED data of SynchroScan Timebase 1-4 with 2 gaussians yields :
| Time base | Angle |
| 1 | -0.433 |
| 2 | -0.411 |
| 3 | -0.409 |
| 4 | -0.416 |
(average angle = -0.417)
NB: for all 4 datas : a 2nd degree polynomial fits better !
Using the same method to fit the LED data of SingleSweep 5-50nswith 2 gaussians yields :
| Time base | Angle |
| 5 ns | -0.428 |
| 10 ns | -0.585 |
| 20 ns | -0.464 |
| 50 ns | -0.473 |
| 50 ns B | -0.418 |
| 50 ns C | -0.397 |
NB: for all datas : a 2nd degree polynomial fits better !
It might be that it’s not the CCD camera which is slightly rotated, but e.g. the sweep electrodes are slightly non-uniform, so the electrons are not swept perfectly vertical (in time), but slightly deviated.
Streak Camera : Triggering
The photodiode
A little bit of the light of the Mira, is reflected with a transparent pellicle to the C1808-03 photodiode. [ a spare pellicle is in the cupboard. Thorlabs BP108].
It look like the pellicle works as an interference filter, so the reflection is lower at certain wavelengths.
Here is a graph of the percentage reflection (P-polarization. The laser is horizontally polarized) :
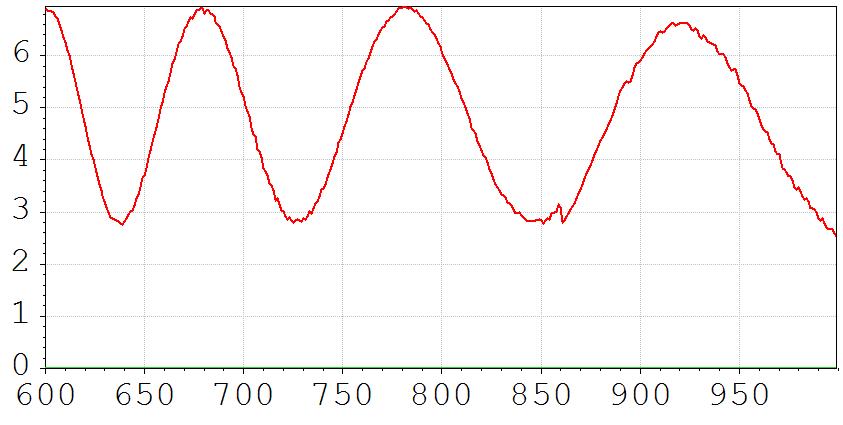
The green light at the side of the streak camera indicates if it gets triggered. If it is not on (and the mira is modelocked), open the variable OD-filter, or put the HP amplifier to 40 dB.
If there is too much trigger signal, it is also not good.
According to manual : “Instruction manual for universal streak camera C5680” , near end :
Light on photodiode : 500 micro-W = 5 mW @ 800 nm : output level : 1.5 V p-p in 50 Ohm
Single sweep
The Single sweep unit uses the trigger signal of the photodiode, but also a signal of the pulse picker. In the C4792-01 menu, the Trig.Mode should be set to Dump Mode !! Otherwise the green trigger light on the side of the streak camera just blinks once a second.
Display on scope
If the signal of the photodiode should be placed on the oscilloscope, then before disconnecting the coax from the photodiode, first the bias power should be turned off.
Streak Camera : Entrance slit
The 0 position of the micrometer is exact. 'Just' closed, is exact at 0.
The first 1 mm of the micrometer is very 'fine' 1-5 mm is 'course'.
This also is shown by the horizontal lines on the fixed part of the micrometer.
The lines for the first mm are spaced further apart then the lines 1-5 mm.
Focus mode : 0-5 mm
Streak mode : 5-30 micron (according to manual) (Ben : 20 micron)
Streak mode, faint light : 30-100 micron (acording to manual)
The slider above the slit-micrometer should be no larger the the width of the photocathode (according manual).
If there are any vertical stripes on the spectrum, it is possible that there is a dust particle on the slit : Instead of going from 0→ 20 micrometer, open it much more, and then go back to 20 micrometer.
Red UNCAL light
NB : in focus mode the uncal light is always on !!
This error light can go on when using the synchroscan unit. The timebase runs sychronously with the 79 MHz (?) of the Mira laser, using a phase locked loop. If the frequency differs to much, the “SWR” Standing Wave Ratio (reflection/absorbtion) becomes to high, the time base stops and the red UNCAL light goes on.
The frequency can be adjusted with a little screw on the synchroscan unit, on the front, left, between the cooling ribs. It's difficult to adjust, maybe a plastic screwdriver is needed. Use it, to make the SWR as low as possible.
Best, first try it with timebase 2, and then switch to timebase 1.
If the synchroscan unit becomes warmer (mostly timebase 1), the SWR rises again.
Working stable with timebase 1, requires it to warm up for 1 hour : do not put it in 'Focus' mode, but keep it on 'Operate'.
Obviously, the trigger signal should be large enough (green led on the side should be on).


